
Fichier:Life expectancy vs healthcare spending.jpg

Taille de cet aperçu : 619 × 599 pixels. Autres résolutions : 248 × 240 pixels | 496 × 480 pixels | 793 × 768 pixels | 1 058 × 1 024 pixels | 1 876 × 1 816 pixels.
Fichier d’origine (1 876 × 1 816 pixels, taille du fichier : 553 kio, type MIME : image/jpeg)
Ce fichier et sa description proviennent de Wikimedia Commons.
Description
| Description |
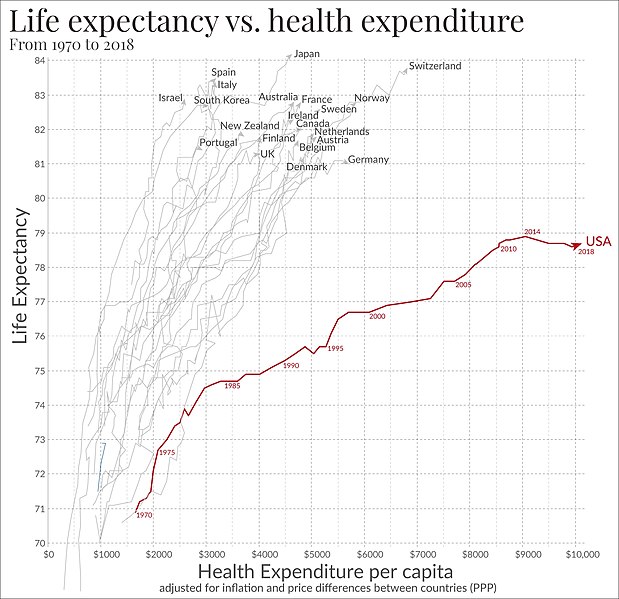
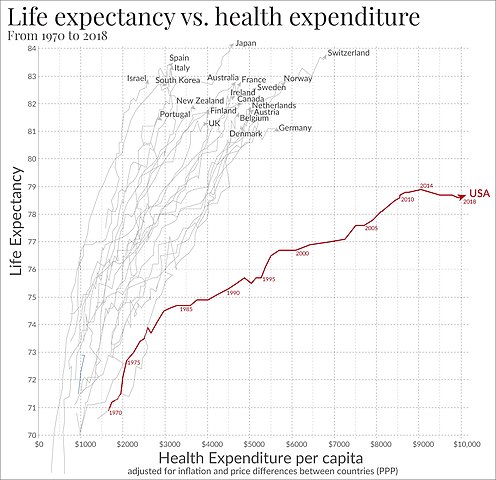
English: Life expectancy compared to healthcare spending per capita by country from 1970 to 2018, in the US and other rich OECD countries. US average of $10,447 in 2018. See en:List of countries by total health expenditure per capita. See the sources tab of the original article linked below. It says the definition of health spending given by the OECD is the following: "Health spending measures the final consumption of health care goods and services (i.e. current health expenditure) including personal health care (curative care, rehabilitative care, long-term care, ancillary services and medical goods) and collective services (prevention and public health services as well as health administration), but excluding spending on investments. Health care is financed through a mix of financing arrangements including government spending and compulsory health insurance (“public”) as well as voluntary health insurance and private funds such as households’ out-of-pocket payments, NGOs and private corporations (“private”). This indicator is presented as a total and by type of financing (“public”, “private”, “out-of-pocket”) and is measured as a share of GDP, as a share of total health spending and in USD per capita (using economy-wide PPPs)." |
| Date | - date of original publication of Max Roser article. Since updated. |
| Source | Link between health spending and life expectancy: US is an outlier. May 26, 2017. By Max Roser at Our World in Data. Click the sources tab under the chart for info on the countries, healthcare expenditures, and data sources. See the later version of the chart here. |
| Auteur | Max Roser |
| Autorisation (Réutilisation de ce fichier) |
CC-BY-SA-4.0 |
| Autres versions | Earliest uploads are of a chart adapted from one found in "America’s inefficient health-care system: another look". Consider the Evidence (blog) by Lane Kenworthy. |
Conditions d’utilisation
Ce fichier est sous la licence Creative Commons Attribution – Partage dans les Mêmes Conditions 4.0 International.
- Vous êtes libre :
- de partager – de copier, distribuer et transmettre cette œuvre
- d’adapter – de modifier cette œuvre
- Sous les conditions suivantes :
- paternité – Vous devez donner les informations appropriées concernant l'auteur, fournir un lien vers la licence et indiquer si des modifications ont été faites. Vous pouvez faire cela par tout moyen raisonnable, mais en aucune façon suggérant que l’auteur vous soutient ou approuve l’utilisation que vous en faites.
- partage à l’identique – Si vous modifiez, transformez, ou vous basez sur cette œuvre, vous devez distribuer votre contribution sous la même licence ou une licence compatible avec celle de l’original.
Historique du fichier
Cliquer sur une date et heure pour voir le fichier tel qu'il était à ce moment-là.
| Date et heure | Vignette | Dimensions | Utilisateur | Commentaire | |
|---|---|---|---|---|---|
| actuel | 11 mars 2022 à 20:52 | | 1 876 × 1 816 (553 kio) | Timeshifter | Latest graph from source. |
| 9 février 2017 à 02:07 |  | 1 805 × 1 747 (559 kio) | EllenCT | higher resolution; cropped | |
| 9 février 2017 à 01:55 |  | 550 × 623 (126 kio) | EllenCT | more detailed presentation of the same data | |
| 12 septembre 2012 à 06:38 |  | 286 × 285 (27 kio) | Cupco | crop out caption text | |
| 12 septembre 2012 à 04:50 |  | 321 × 328 (32 kio) | Cupco | User created page with UploadWizard |
Utilisation du fichier
Les 2 pages suivantes utilisent ce fichier :
Usage global du fichier
Les autres wikis suivants utilisent ce fichier :
- Utilisation sur en.wikipedia.org
- Life expectancy
- Health system
- Life extension
- Social services
- Health care
- Health economics
- Healthcare industry
- Universal health care
- Comparison of the healthcare systems in Canada and the United States
- Healthcare in Canada
- Economic history of the United States
- Healthcare in Europe
- Healthcare reform in the United States
- Healthcare reform debate in the United States
- List of countries by total health expenditure per capita
- Health care reforms proposed during the Obama administration
- Healthcare in the United States
- List of countries by health insurance coverage
- Talk:United States/Archive 47
- List of countries by total health expenditure by type of financing
- Talk:United States/Archive 89
- User:Prototyperspective/Timeline of governance and policy studies 2020–present
- Health spending as percent of gross domestic product (GDP) by country
- Utilisation sur en.wikiquote.org
- Utilisation sur et.wikipedia.org
- Utilisation sur hy.wikipedia.org
- Utilisation sur pt.wikipedia.org
- Utilisation sur ro.wikipedia.org
- Utilisation sur tr.wikipedia.org
- Utilisation sur uz.wikipedia.org
- Utilisation sur vi.wikipedia.org
- Utilisation sur zh.wikipedia.org